Sorry! This event date has passed...
Arts And Entertainment
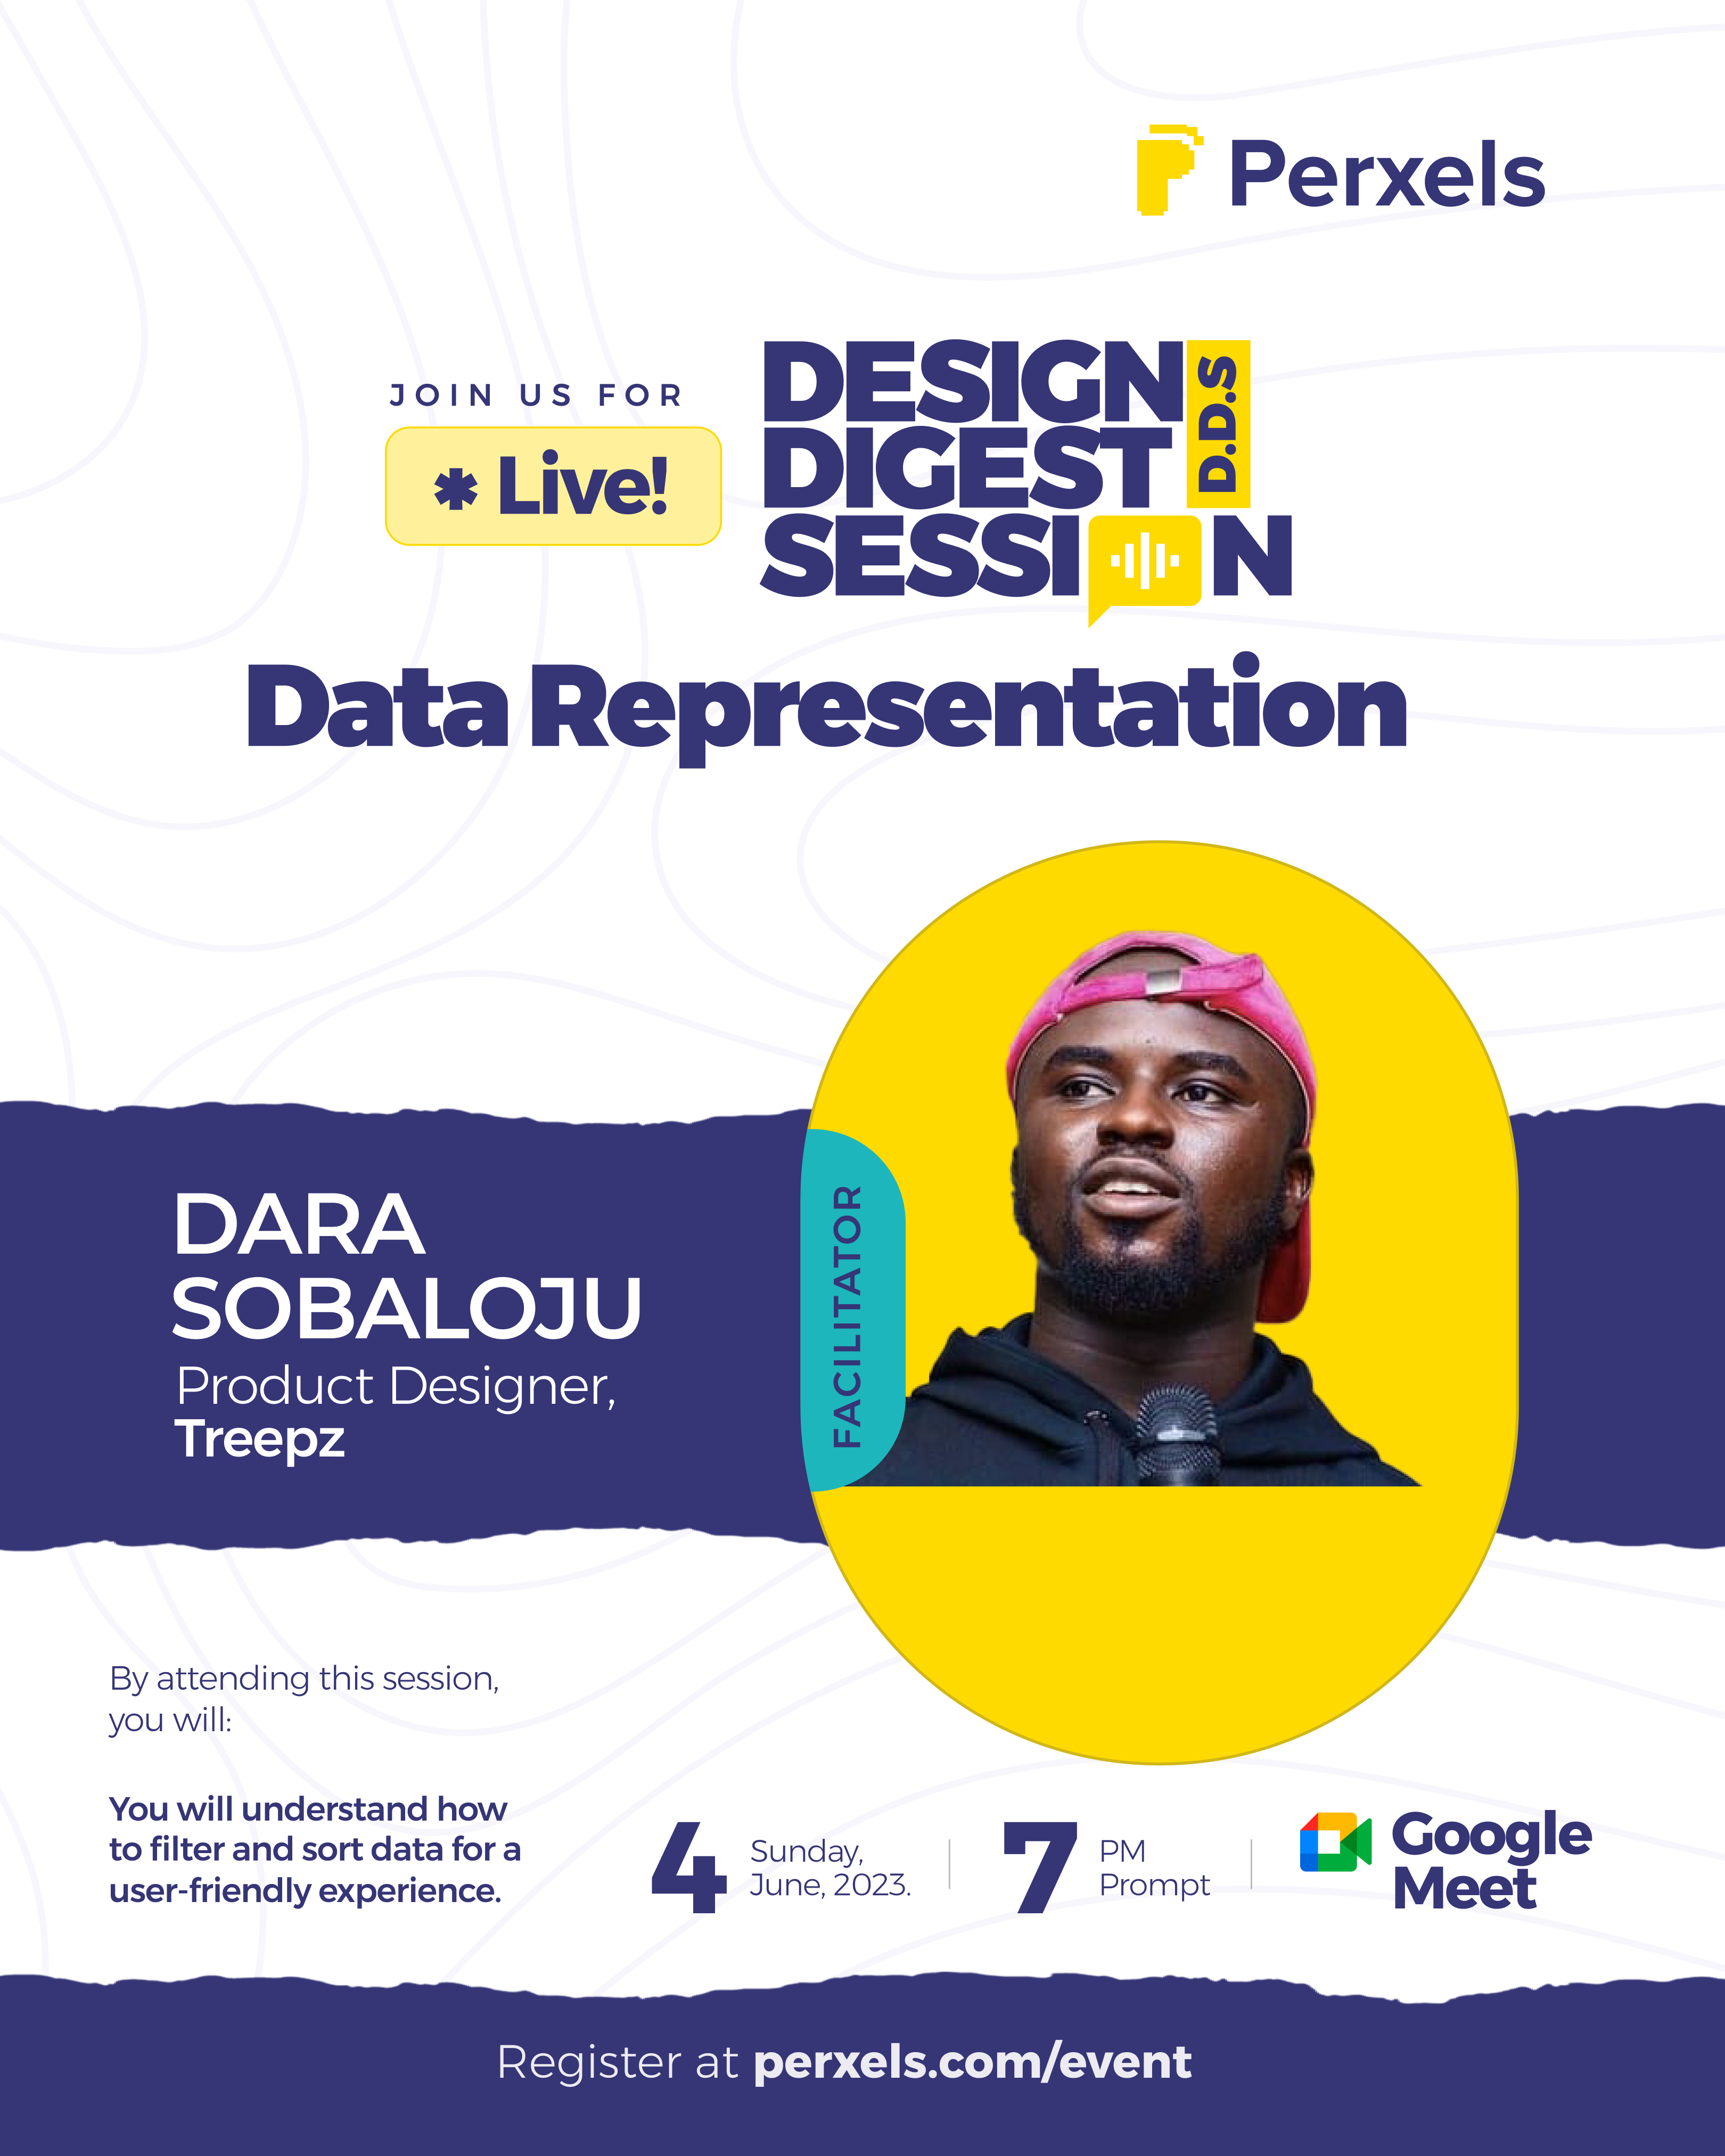
Google Meet
Post events in Nigeria, free and paid events. Find events around you, register for free event, buy tickets, sell tickets online and promote your event in Nigeria.
Helpful Links
Connect with us
© 2026 Tickethub.ng. All Rights Reserved.